The Futility of Forecasting
In this issue
- Market forecasts do not have a great record
- Markets are impacted by too many variables to be able to lend themselves to consistent prediction
- S&P 500 companies set to payout over $500 billion in dividends in 2020
- Importance of investor psychology & its unpredictability
One of the age-old traditions of the investment industry is to issue predictions for how the financial markets will make out in the coming year. Financial author Jason Zweig, in his book The Devil’s Financial Dictionary, refers to forecasting as “the attempt to predict the unknowable by measuring the irrelevant.”
Most forecasts are based on variables such as interest rates, estimates of corporate profits and economic growth rates – amongst others. But therein lies the problem according to critics of stock market forecasting. Markets are affected by a broad spectrum of factors which range from the economy, international conflicts, interest rates (monetary policy), politics and even weather. In addition to all of these factors is investor psychology (sentiment).
Given all of the unknowable factors, it is amazing that market predictions are not taken with a greater degree of skepticism. Given these wide-ranging variables, market forecasters would have to have quite a crystal ball to see how these variables will combine to impact the markets. At the best of times, these variables are rather nebulous. It is amazing how much disregard Wall Street shows for the unexpected and random events that inevitably occur.
Guarding Against Random Events
Given the complexities involved in providing a useful stock market forecast, what is an investor to do? The perils and vagaries of forecasting can be countered by focusing on fundamentals. This might not be as exciting as a forecast into the future but as academic research and experience show, the answer is to focus on the fundamentals and look at what could upset the consensus.
There are three factors that determine returns in the stock market. It is the sum of two fundamental variables (dividend yields plus earnings growth) and a behavioral or speculative portion variable (P/E Multiple—how much more or less are people willing to pay for corporate earnings).
Though it might be tempting to think that this would mean it is easy to predict what the return for any given stock would be – that would be incorrect. This is because each of these three factors are then impacted by many factors themselves. At a high level, we can start to see how difficult forecasting can be.
Figure 1 below shows what has driven US equity returns by decade for over 100 years. There have been decades where dividends have been significant contributors to equity returns and in some decades, equity returns have been dominated by a change in the P/E multiple.
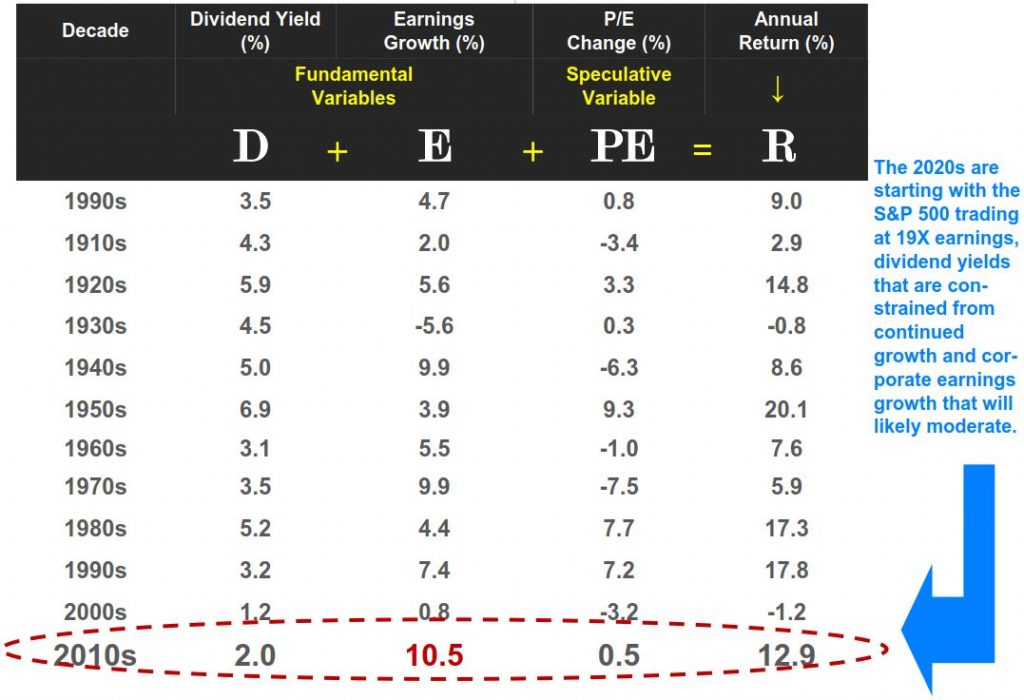
Table: Ben Carlson (A Wealth of Common Sense). Source: Jack Bogle
Some commentators have stated that they believe the current market cycle that began in 2009 is a house of cards that has been built on the back of money printing by the central banks, stock buybacks from corporations, low-interest rates and investor willingness to pay more and more for each dollar of corporate profits (multiple expansion). In short, they believe that the stock market has gotten ahead of the underlying fundamentals of corporate America. However, the data below shows that the vast majority of the gains over the past decade can be explained almost exclusively by improving fundamentals. Earnings growth and dividends explain nearly 97% of the annual returns for the 2010s with the change in valuations (i.e. P/E multiple change) playing a minor role in explaining the gains during this cycle.
It should be noted that the earnings numbers were at historically low levels by the end of the 2000s because of the financial crisis.
Roaring or Boring Twenties
When we look at the table and wonder what the 2020s will bring in terms of market returns, we can look at the components of total return and highlight some of the factors that will impact them. In turn, we can create a checklist to see what might impact returns going forward.
Dividend Yields
In the previous decade, US corporations responded to the demand of investors for strong dividends. The demand for dividend income is brought about by the fact that interest rates are at generational lows. As the data in Figure 2 below shows, US companies in the S&P 500 index paid out $485 billion in dividends to their shareholders in 2019. Current estimates from Standard and Poor’s show that investors should expect dividends to be over $500 billion for the first time ever – an increase of 4.5% from the 2019 levels.
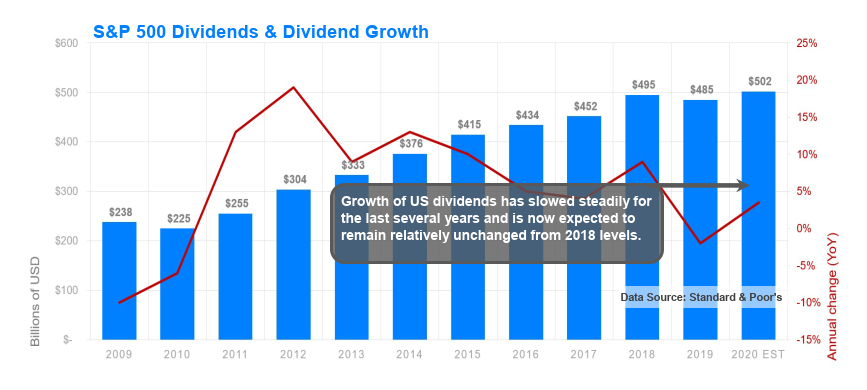
Data Source: Standard & Poor’s
Standard and Poor’s current data shows that for the companies in the S&P 500 index, 423 or 84% of them pay a dividend. The data also shows that in 2019, these companies collectively increased their dividends 355 times and seven companies were forced to cut their dividends. Furthermore, the dividend increases averaged 10%. The largest dividend increases were concentrated amongst the large US banks (JP Morgan, Citigroup, Wells Fargo and Bank of America) and the largest technology companies. From our perspective, unless there is a surprise shock to the economy or a change in policy from the US government on tax policy, current dividend trends should remain in place for 2020.
Looking out further, one particular constraint we see on dividend growth for many sectors of the US economy is that many corporations have been enhancing their dividends by borrowing cash. This has allowed them to increase their dividends to levels above what they would be solely based on their profits. Said another way, many corporations have been borrowing to pay shareholders.
Going forward, the companies that are able to organically grow their earnings or have a low need to reinvest in their business for future growth will be the ones with the fastest rising dividends.
Particular mention should be given to the US banks. With their recovery from the Great Financial Crisis, we expect the US banks to continue to be dividend growth leaders for some time yet but at a more moderate pace than in the previous five-year period.
Earnings Growth & Economic Growth
Over the last decade, economic growth rates around the world have slowed. This has challenged earnings growth rates for many corporations as their end markets are not growing as quickly and sales growth is harder to come by. At the same time, many industries have seen their pricing power eroded due to the effect of the internet on competition.
Despite these headwinds, earnings growth in the 2010s was the highest of any decade since 1900. The skeptics claim that earnings growth has been helped by stock buybacks where corporations are buying back their own shares to reduce their share counts. This reduction then makes it easier for corporations to show an increase in earnings per share (EPS). They argue this behavior has propped up the stock market. Criticism has become particularly heated recently as companies repurchased more than $1 trillion in of their own shares over the past two years. But Standard & Poor’s data shows that critics of buybacks are wrong; its conclusion is that buybacks have had little impact on EPS and are not propping up the stock markets.
In aggregate, S&P data finds that the buyback effect was small—on average just 1.4% from the beginning of 2017 through the end of 2018. Over the past two years, when companies purchased over $1 trillion of their own shares, buybacks increased EPS growth by less than 1.5%. The data also shows that the S&P 500 buyback index has underperformed relative to the S&P 500 over the last 12 months. Thus, there is a strong fundamental underpinning to the corporate earnings growth that has been in place since 2009.
It must be noted that some companies have squandered billions of dollars on buying back their own stock but failed to recognize that they were buying back the stock of a fundamentally bad business. This shows that corporations should be judicious in their buyback policies. Clearly, not all buybacks are created the same.
The Price of Earnings
The third component of the market return formula is the change in the PE multiple—or the price that investors pay for each dollar of a company’s earnings. Of the three variables, this is the variable that depends upon investor sentiment (mood). If investors are in an optimistic mood, they will raise the PE multiple. If they are fearful, they will reduce the PE multiple and hinder stock market returns.
It is important to note that from time to time, investor psychology can become extremely euphoric or pessimistic. These extreme mindsets can persist for periods that are far longer than one would think possible. However, these emotional extremes can be helpful to a long term investor because they can create bargains to be acquired or wild overvaluations that should be sold into.
As we see from this brief overview, there are many factors which impact market returns. While market predictions are interesting to hear and read about, investors would be better served by being reminded that markets are not always rational and history shows that irrationality in either direction cannot be predicted. We can look no further than the start 2020 has had to see how events can impact forecasts.